The statistical data page is currently the highest reported, but at least the B2B team is serious about GEO assets. The idea is straightforward: the AI engine needs to back up the numbers when it answers the questions, and a page that cleans up key data on a particular subject, labels it out, updates it regularly, is exactly the source they like most. You don't have to do your own original research, but you can be named by ChatGPT, Perplexity and Google AI Overviews if you combine scattered numbers into a good quote.
Why are the pages being used crazyly?
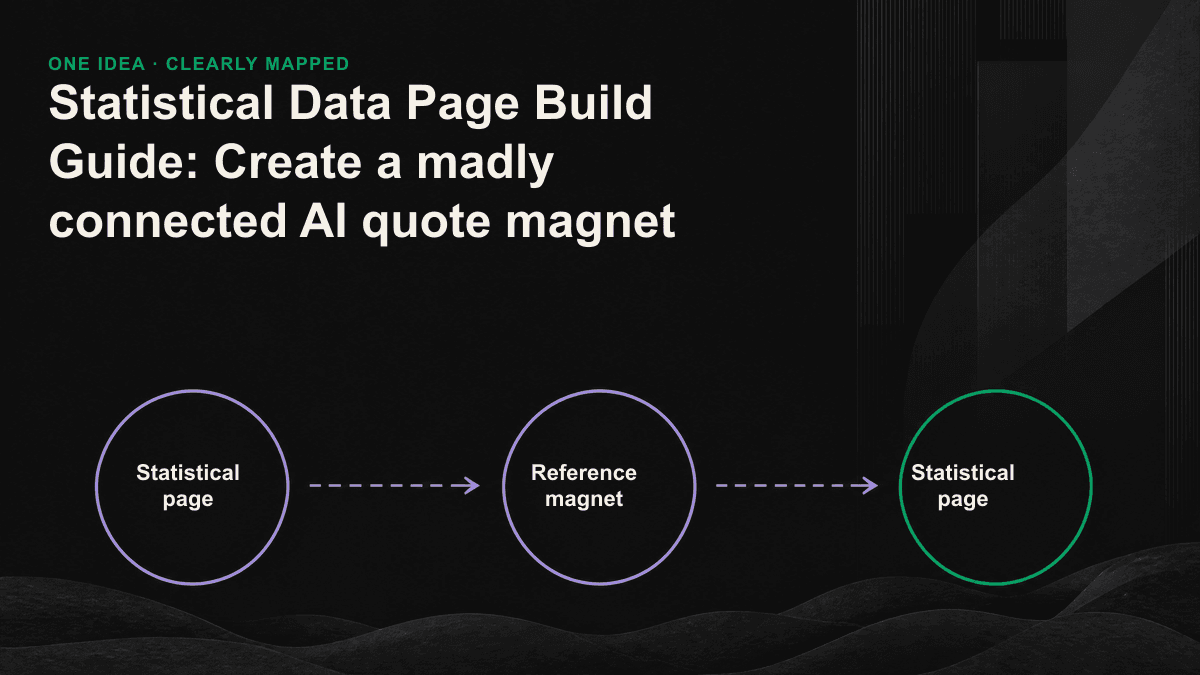
When the author quotes a number, he rarely turns back to the original government report or an academic paper, and they link to a page where the number is organized and where it comes from. So your page becomes a "Quote Shortcut": someone saves their power to verify, and you get a natural reverse link. The connection is not from outside, but from the actuality of the content itself, and it accumulates quickly and steadily.
The preferences of the AI engine overlap highly with the human author. When the model extracts the answer, it likes to say a word to a paragraph with a fact, a clear number, a source and a year. This is the structure of the statistics pages, each of which is an independent, verifiable and clean move. In contrast, a plethora of long-written articles, the model has to be detached to find the number, the cost of extraction is high, and the chances of being quoted are naturally low.
Topic: What is it worth doing alone?
Not every subject fits. The value of the statistics page is "someone will search over and over again the number of the subject, and there is no clean site on the market." We usually look at four conditions.
- Search demand is stable: some people are constantly looking for "statistical data on a certain industry/activism" such as "Taiwan B2B SaaS Loss Rate Statistics" "Electro-Liberate Dismissal Data".
- Numbers scattered and expired: the result is either hidden in PDF or quoted from the old figures three years ago, and no one is responsible for updating.
- Close to your business: The subject is close to what you sell, so your people and your potential clients overlap.
- There are enough numbers to make a page: a theme that can produce at least 15 to 30 meaningful data, too few pages to support a link.
When it matches the first three but the numbers are insufficient, it is possible to combine the next-party themes into a single page, such as the "discard rate" "account conversion rate" "motive conversion difference" into the same ecommerce conversion statistics page, which is more complete and worthy of being linked.
Every piece of data should be written.
This step has been decided. Most of the pages fail not because the numbers are bad, but because the numbers are wrapped in narratives that allow engines and readers to dig. The correct approach is to write each piece of data as a self-contained unit: to conclude with a number, to add a background and source, and to say one thing. To avoid vague attributions such as "showed by multiple studies", it is necessary to name and place them.
Page Structures and Marks
The entire page divides the data theme with a clear block title (H2) so that readers can skip and the engine can understand the connection of each set of numbers. It starts with a summary of two or three sentences, with a direct click on "How many of the most recent statistics on a topic on this page are last updated for a month" and is often cited by AI as a page. Adds Article or Dataset to the structured data and clearly indicates the source and the year in each bar, which further increases the probability of being found to be a credible source.
The competitive advantage of the statistical pages is not how many numbers you collect, but what others believe are the latest. If the expired statistics pages are discovered, they will be permanently bypassed.
The updated rhythm determines how long it's gonna live.
The statistics page is an asset that will be obsolete. A page with three years of numbers and "the latest statistics" on it, once caught by a reader, loses trust and is downgraded by the AI engine. The practical approach is to write down the source and capture date for each bar, schedule a fixed quarterly or semi-annual check, replace the expired number and update the "last update" time on the page. This maintenance operation is itself a moat: most people do it once, and the pages that are willing to be updated will slowly take all the references.
How does it begin to be connected?
The page is on the line only at the starting point, and the first links usually have to be set on fire and then roll.
- Who has already quoted the numbers: Search for your theme, find the author who has quoted old data or expired sources in the article, and send a short letter to replace your updated page.
- Make a single bar of data into a shared graphic: a map of numbers and provenance, with links to your page, is easier to turn in the community than the entire page, and links are taken out every time it is sent.
- Linking to other content in your home: Every time you mention a number in your blog, you go back to this page and build on it.
- Regular visits quote your page: who is being followed by a link, and authors close to the subject often repeat it and deserve to be connected.
How do you know if it worked?
The measurement page cannot look at organic traffic alone, because many values happen outside your website -- people see you in the AI answer, you see your numbers in other articles. Three things really need to be pursued: how many inverse links this page has accumulated, the frequency you have been mentioned when ChatGPT asked questions about ChatGPT, and how many end-of-the-life clients have first contact with this page. The first two require a continuous visual tracking to see how your name appears in the AI answer, which is one of the core indicators that we use AI visibility monitoring to target our clients.
The statistics page is not an article that ends with an article, but a reference asset. Select the theme, write each number as a clean unit, mark the source, and update it on a regular basis. It will continue to build up links and AI in the coming months. If you want to know what data gaps you're dealing with are worth doing first, and where your current visibility in the AI answer is, you can book a 30-minute GEO diagnostic session, and we'll identify the first page.